Table of Contents
Profile group
Command: PROFILE GROUP
Description
The Profile group ![]() creates several terrain sections of triangulations, grids and difference bodies along a gradient. The following drawing objects can be used as a gradient: Polyline, line, circle, arc or a spline. In terms of application, the command corresponds in many respects to the creation of individual profiles.
creates several terrain sections of triangulations, grids and difference bodies along a gradient. The following drawing objects can be used as a gradient: Polyline, line, circle, arc or a spline. In terms of application, the command corresponds in many respects to the creation of individual profiles.
The creation of profile sections is, among other things, the basis for the documentation of areas and volumes with cross profiles according to the Gauß-Elling method and therefore a prerequisite for a REB-compliant billing.
Application
Create profile group
Quick DGM> right click on a triangulation, Grid , or Difference body> profile group
After selecting the function, the desired gradient can be drawn in the drawing or the cutting line can be selected. Position the cross-sections by selecting the insertion point in the drawing.
Edit profile group
The basics of the profile group can be found on the tab Profile generation (Quick-DTM (AutoCAD based) > Info button) can be changed. One or more surfaces can be activated / deactivated here.
In the case of modeled triangulations or difference bodies, there are two entries, unmodeled and modeled. Thereby means modeledthat the basic state including changes due to inserted modeling is used for the calculation of the profile. Unmodeled works with the original terrain with no added modeling.
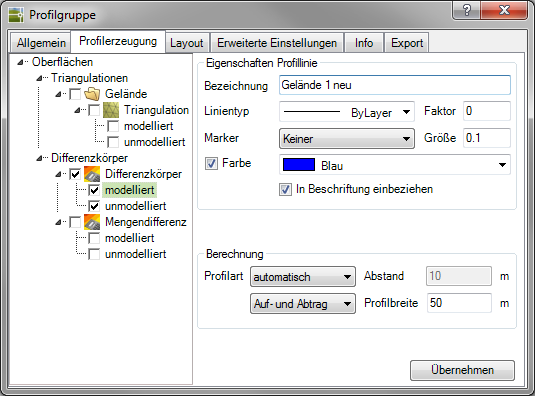
Each selected surface can be configured for display in the profile. Select the relevant entry and change the parameters for the appearance and the labeling.
Thus, for example, the existing site can be shown with a red line and the new planning with a blue line.
For the calculation can you use the Profile type and thus control the number, position and calculation of the individual profiles. The following options are available:
automatically: The automatic option controls the creation of profiles for mass documentation with cross profiles. A complicated procedure is used to create the smallest possible number of individual profiles so that REB-compliant documentation can be carried out using mass formulas. There is only a very small deviation from documentation with prisms. In addition, the Profile width be determined.
at each base: A profile is generated at each support point of the gradient. In addition, a fixed Profile width be specified.
regularly: With this option, a regular distance can be entered, which is removed from the gradient and in which the profiles are created. In addition, a fixed Profile width be specified.
manually: With this option, the stationing can be adjusted manually.
To adapt the stationing, call the dialog Edit stationing by clicking the button [...] click. The existing stationings are displayed in the upper part of the dialog. Here you can delete a stationing by selecting the stationing and clicking with the right mouse button and delete choose. In the lower part of the dialog you can add profiles by entering a distance value or by selecting them in the drawing.
If individual profiles are moved, copied or deleted in the drawing for existing profile groups, the calculation is automatically adjusted to "Manual".
The Profile width can with the option Automatically can also be generated automatically. To do this, enter the value 1 in the input field. The maximum profile width is then calculated and used for all profiles.
Mass list: Used as a basis for profile generation only a surface is selected, the Documented area of the property. If, on the other hand, two surfaces are selected, the volume is documented.
You can also determine whether Application and removal, only order or only removal is displayed within the profiles.
Information like Station, Base height and Area can be found on the tab Info.
It often happens that dimensions overlap in the profiles. With the right mouse button you can select the option for the desired profile, Dimensions can be moved. You can move the superimposed dimension figures in the profile so that all information is visible.
Features
Layout tab
On the tab layout define in the area Lettering profile lines the appearance of the texts in the profile: title, color, text style and text size.
Note the Edit a text stylethat this only affects the texts in the existing profile, but not the profile as a whole.
To be able to adjust text sizes, are suitable variable text styles. Read the chapter on this Text style under Important instructions.
For the Title can be different variables can be selected using the arrow:
| designation | Symbol | Example |
|---|---|---|
| Profile number | %N | Cut 1 |
| Double profile number | % N -% N ' | Section 1-1 ' |
| Profile number ' | % N ' | Cut 1 ' |
| Station (distance to first cut) | %S | 99.65 |
| Profile area (with REB mass formulas) | %F | 78.67 |
| Life Mission | %P | 12.34 |
| Removal | %C | 43.21 |
| additional manual options for the station | ||
| - starting value | % S [23.5] | 23.5 |
| - thousands + hundreds | % S [+] | 2 + 900 |
| - Thousands + hundreds (with starting value) | % S [+73.2] | 0 + 073.2 |
With an option, the Label the other side. Enter the value in the adjacent field or select a variable using the arrow.
You can also use this entry for the profiles Use as title. The entry will then be a %T prefixed. To deactivate, select using the arrow Do not use it as a title anymore .
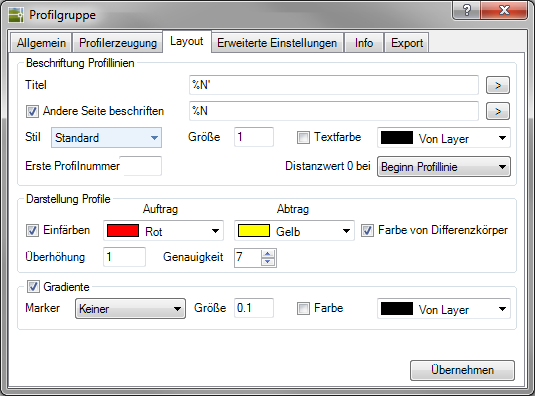
Unless at Title one of the values for Profile number has been selected, you can choose for the First profile number set the start value.
For the Distance value there are 3 options: At Start of profile line the first point of the line is the start of the stakeout for the distance. At Beginning of terrain the first contact with the terrain is set as a reference point. At Gradient the gradient course is used as the zero point. Is also the Gradient area activated, the dimension numbers can be inserted into the section starting from this line (ie from the center).
Please note the option Gradientthat the corresponding quantity certificate will contain other values, since the REB does not allow negative entries. A value for a shift is required for this, which is also specified in the quantity statement.
In order to keep the deviation in documented dimensions between the documentation with prisms and with cross profiles as low as possible, the Gradient curve as the longest possible axis run through the DTM object.
| Properly | Wrong |
 |  |
In the area Representation of profiles can with the option Coloring, specify that the profile sections are filled with the defined colors for application and removal. Filling profiles is very suitable for presenting the profiles clearly and in a visually appealing way. The option Color of difference body then uses the colors defined in the difference field.
In addition, a Cant can be set. An exaggeration of 1 corresponds to a mapping of the real values. The value 2 doubles the differences that occur in order to show them more clearly.
Within the Calibration values from 1 to 10 can be set. This can be used to control an internal calculation in which height point information that is not required can be removed from the profile. This simplifies the presentation and clarity. The algorithm checks whether a point lying between two points is also on this connecting line. If so, it will be removed from the profile display. With the set value, the absolute deviation from the height profile is determined. The higher the value, the more detailed the terrain is shown in the profile.
In the area Gradient the cutting line can also be drawn in the cuts.
Advanced Settings tab
On the tab Label for title, dimensions and dimension line titles, the Size and the Color can be set. You can also adjust the alignment of dimensions and determine the color of the dimension lines. For the Dimension line title Distance a different name can be specified. You also set the number of decimal firmly.
On the tab presentation can the Profile frame switch visible / invisible. You can define the height of the profile. The width of a profile is largely determined by the length of the profile line in the drawing. about Distance start and Distance end a fixed value can be entered that defines the distance between the terrain and the profile boundary. For the end of the profile there is also the option of rounding up to full digits (e.g. 10).
You have in the Advanced settings, the ability to specify in how much Split or String the cuts side by side or among themselves should be created.
If the profile group contains several surfaces (see also Profile creation tab), you can use the sequence the order in which the dimension lines of the surfaces should be displayed in the section. The gap Visible indicates whether the interface is displayed. In addition, the designation the surface can be edited.
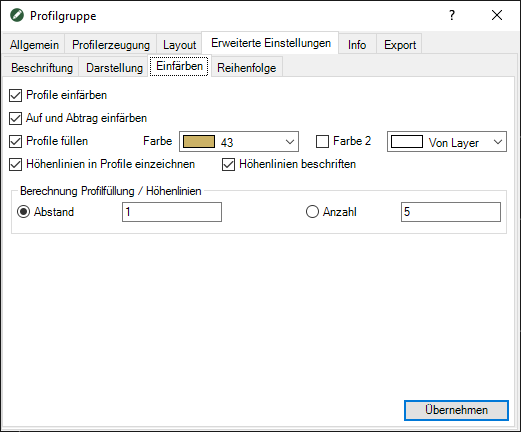
On the tab Coloring the color filling can be activated / deactivated (Color profiles, see also Layout tab> Profile display). The settings too Color on and off are used from the Layout tab. A color is preset here by default. As soon as you select a second color, the input is removed from the area calculation used (see example: fill profile (two colors)).
Example: Coloring on and off
The entire profile can be filled with one color (Fill profiles), whereby the insertion area is determined automatically (minimum and maximum height in the terrain). A second color can also be added.
Example: Coloring on and off cuts + fill profiles (one color)
You can also use the Draw contour lines in profiles.
Example: fill profile (two colors) + contour lines
For the calculation of options Fill profiles and Draw contour lines in profiles on the one hand the distance and on the other hand the Quantity of the intervals can be specified. The colors for the intermediate values of the profile filling are interpolated.
In addition, the contour lines can be set with the option Label contour lines must also be labeled with the height information.
The settings on the tabs General, Profile generation, layout and Advanced Settings... can in dialogue Configuration (please refer Quick-DTM (AutoCAD based)) can be defined as a default for all further drawings.