Table of Contents
Export of DTM data
Description
With the functions in the tab Export you have the option of exporting various DTM objects in other formats.
For the export of DTM data you can choose between the export as DXF file, to Excel, as ASCII- or. CSV file, Export according to REB selection, XML, CountryXML and after different GAEB / REB process descriptions to be chosen.
Application
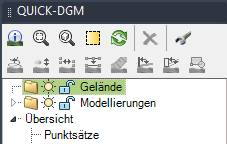
The export of DTM objects is object-dependent. To do this, select in the window Info (please refer Quick DGM) the tab Export. If, for example, a triangulation is exported to a REB data set, the assigned point and edge sets are generated in addition to the triangles.
Features
Export as a DXF file
When exporting as a DXF file, point sets, triangulations, modeling and axes can optionally be transferred, for example in a Machine control to use.
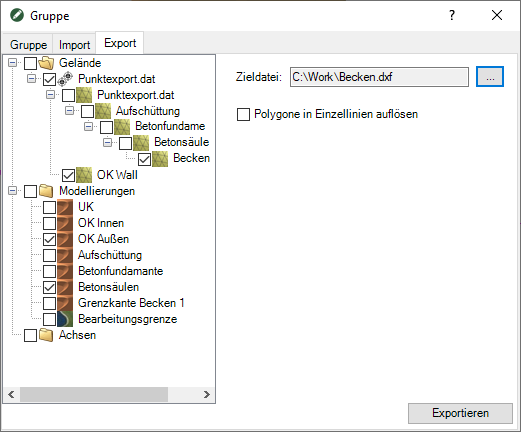
The exportable content is available on the left-hand side of the window and can be selected by ticking the box. Enter the file name and path of the file to be created by clicking the […] button.
Activate the option if the polygons of the modeling are to be divided into individual lines Dissolve polygons into single lines.
The export as a DXF file is only available on the top node terrain available in the tree of the Quick-DGM.
Export to Excel
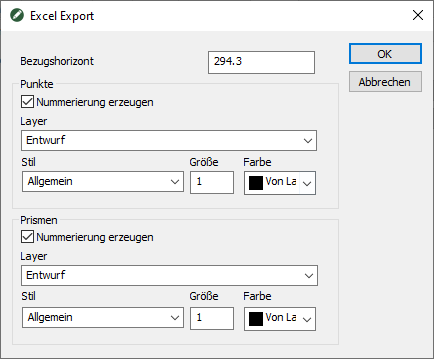
When exporting to Excel, the data is immediately entered in an Excel table and formatted correctly.

Point set
Direct output of the point set, with the point number, the coordinates X, Y, Z and the description being output in columns. Creation of the column headings: point number, X value, Y value, Z value, description.
For example:
| Point number | X | Y | Z | Description |
| 1 | 100.00 | 100.00 | 100.00 | |
| 2 | 103.00 | 90.00 | 99.86 | Tree |
| 3 | 103.00 | 110.00 | 100.13 | |
| 4 | 106.49 | 97.78 | 101.55 | |
| 5 | 110.00 | 83.00 | 99.7 |
triangulation
Direct output of the triangles of the triangulation, whereby the triangle number and the three associated coordinates X, Y and Z are output in columns. Areas are also documented.
Creation of the column headings: Triangle, X value, Y value, Z value, projected area, developed area, mean height.
Example: Prism documentation for triangulation Terrain1.dat
| triangle | X | Y | Z | proj. area | turned away area | average height |
| 1 | 100.00 | 100.00 | 100.00 | |||
| 103.00 | 90.00 | 99.86 | ||||
| 106.49 | 97.78 | 101.55 | 29.12 | 30.30 | 0.96 | |
| 2 | 106.49 | 97.78 | 101.55 | |||
| 103.00 | 110.00 | 100.13 | ||||
| 100.00 | 100.00 | 100.00 | 35.78 | 36.69 | 1.05 |
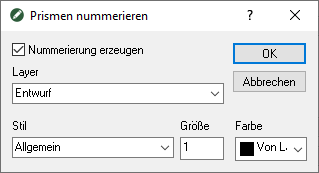
After calling the function, the triangles can also be labeled with the triangle numbers used. These are important for an overview plan and the verifiability of the documentation.
Grid
Direct output of the grid cells of the surface, whereby the cell number and the three associated coordinates X, Y and Z are output in columns. In addition, the areas are documented. The mean height and volume are not calculated.
Creation of the column headings: grid cell, X value, Y value, Z value, projected area, developed area.
Example: Documentation for grid network Terrain1.dat
| Grid cell | X | Y | Z | proj. area | turned away area | average height | Volume |
| 1 | 100.00 | 79.00 | 99.51 | ||||
| 100.74 | 79.00 | 99.51 | |||||
| 100.00 | 79.74 | 99.51 | |||||
| 100.74 | 79.74 | 99.51 | 0.54 | 0.54 | 0.00 | 0.00 | |
| 2 | 100.74 | 79.00 | 99.51 | ||||
| 101.47 | 79.00 | 99.51 | |||||
| 100.74 | 79.74 | 99.51 | |||||
| 101.47 | 79.74 | 99.51 | 0.54 | 0.54 | 0.00 | 0.00 |
Difference body
There are two options for exporting the difference body to Excel:
Standard
Direct output of the prisms of the differential body, whereby the prism number and the three associated coordinates X, Y and Z are output in columns. Areas and volumes are also documented.
Creation of the column headings: prism, X value, Y value, Z1 value, Z2 value, projected area, average height, volume (reference Z1 to Z2).
Example: Prism documentation for differential body Terrain1.dat
| Prisma | X | Y | Z1 | Z2 | proj. area | average height | Volume |
| 1 | 116.87 | 99.77 | 100.00 | 103.20 | |||
| 116.87 | 106.04 | 100.00 | 102.16 | ||||
| 112.52 | 106.02 | 102.01 | 102.01 | 13.65 | -1.78 | -24.36 | |
| 2 | 112.52 | 106.02 | 102.01 | 102.01 | |||
| 116.51 | 99.01 | 103.31 | 103.31 | ||||
| 116.87 | 99.77 | 100.00 | 103.20 | 2.80 | -1.07 | -2.99 |
After calling the function, the prisms can also be labeled with the prism numbers used. These are important for an overview plan and the verifiability of the documentation.
similar to REB 22.013
Direct output of the points, the prisms of the reference surface, the prisms of the target surface and the result. The point list with the point number, the associated coordinates X, Y, Z1 and Z2 and the prism lists with the prism number, the three associated point numbers and the average height are output in columns. Areas and volumes are also documented.
Creation of the column headings:
Point list: point, X value, Y value, Z1 value, Z2 value
Prism lists: prism, point 1, point 2, point 3, mean. Height, proj. Area, surface, volume
Example: Documentation for differential body volume 1 / tria 1
| Punkt | X | Y | Z1 | Z2 |
| 1 | 116.87 | 99.77 | 100.00 | 101.00 |
| 2 | 116.87 | 106.04 | 100.00 | 101.00 |
| 3 | 112.52 | 106.02 | 102.01 | 101.00 |
| 4 | 112.52 | 106.02 | 102.01 | 101.00 |
| 5 | 116.51 | 99.01 | 103.31 | 101.00 |
| 6 | 116.87 | 99.77 | 100.00 | 101.00 |
Z1 corresponds to the height on triangulation Tria 1 (unmodeled)
Z2 corresponds to the height on horizon 101
| Prisma | Point 1 | Point 2 | Point 3 | average height | proj. area | Surface | Volume |
| 1 | 1 | 2 | 3 | 101.37 | 22.60 | 23.08 | 42.12 |
| 2 | 1 | 4 | 3 | 101.11 | 7.63 | 7.79 | 12.21 |
| 3 | 5 | 4 | 3 | 100.54 | 32.14 | 32.81 | 33.00 |
| 4 | 6 | 7 | 8 | 99.70 | 11.72 | 12.07 | 2.19 |
| 5 | 9 | 10 | 11 | 100.38 | 23.08 | 23.67 | 20.01 |
| 6 | 9 | 12 | 11 | 100.71 | 7.78 | 7.98 | 9.33 |
| Prisma | Point 1 | Point 2 | Point 3 | average height | proj. area | Surface | Volume |
| 1 | 1 | 2 | 3 | 101.00 | 22.60 | 22.60 | 33.68 |
| 2 | 1 | 4 | 3 | 101.00 | 7.63 | 7.63 | 11.37 |
| 3 | 5 | 4 | 3 | 101.00 | 32.14 | 32.14 | 47.89 |
| 4 | 6 | 7 | 8 | 101.00 | 11.72 | 11.72 | 17.46 |
| 5 | 9 | 10 | 11 | 101.00 | 23.08 | 23.08 | 34.39 |
| 6 | 9 | 12 | 11 | 101.00 | 7.78 | 7.78 | 11.59 |
| Footprint | Surface | Volume | ||
| Reference surface | 1986.00 | 2022.59 | 2743.23 | Triangulation Tria 1 (unmodeled) |
| Target surface | 1986.00 | 1986.00 | 2959.14 | Horizont 101 |
| difference | 0.00 | -36.59 | 215.91 |
After calling the function, the prisms can also be labeled with the prism numbers used. These are important for an overview plan and the verifiability of the documentation.
Export as an ASCII file
When exporting as ASCII-File, a file format is generated that can be opened and viewed with any editor.
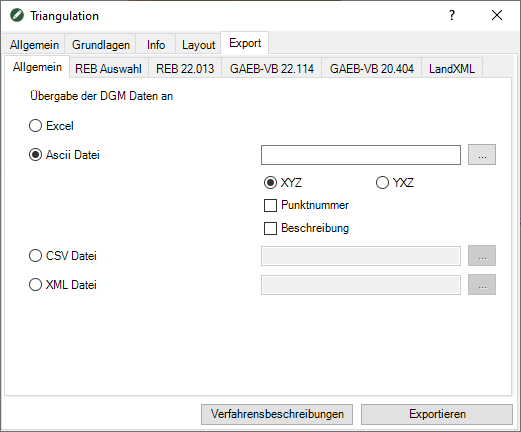
Enter the file name of the file to be created by clicking the button [...] . click
You can optionally post the data X Y Z or after YXZ export sorted. You can also use the Point number and the Description with export.
Point set
Direct output of the point set, whereby the X coordinate, Y coordinate, Z coordinate and the description are listed for each line.
For example:
| 100.0000000000 | 100.0000000000 | 100.0000000000 |
| 103.0000000000 | 90.0000000000 | 99.8600000000 |
| 103.0000000000 | 110.0000000000 | 100.1300000000 |
| 106.4900000000 | 97.7800000000 | 101.5500000000 |
| 110.0000000000 | 83.0000000000 | 99.700000000 |
triangulation
Direct output of all coordinate points of the triangles, whereby the X-coordinate, Y-coordinate and Z-coordinate are listed per line.
For example:
| 100.0000000000 | 100.0000000000 | 100.0000000000 |
| 103.0000000000 | 90.0000000000 | 99.8600000000 |
| 103.0000000000 | 110.0000000000 | 100.1300000000 |
| 106.4900000000 | 97.7800000000 | 101.5500000000 |
| 110.0000000000 | 83.0000000000 | 99.700000000 |
Grid
Direct output of all coordinate points of the grid, with the X-coordinate, Y-coordinate and Z-coordinate listed per line.
For example:
| 100.0000000000 | 79.0000000000 | 99.5100000000 |
| 100.7373737374 | 79.0000000000 | 99.5100000000 |
| 101.4747474747 | 79.0000000000 | 99.5100000000 |
| 102.2121212121 | 79.0000000000 | 99.5100000000 |
Export as CSV file
When exporting as a CSV file, the same content is generated as when exporting to Excel. The columns are separated by a comma or semicolon and can therefore be opened by all common table editing programs.
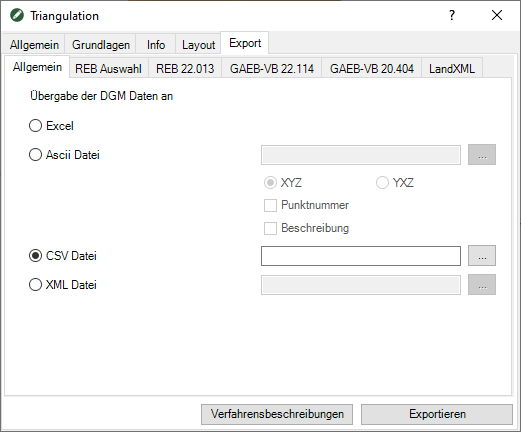
Enter the file name of the file to be created by clicking the button [...] . click
Point set
Direct output of the point set, with the point number, the three associated coordinates X, Y and Z and the description being output in columns. Creation of the column headings: point number, X value, Y value, Z value, description.
Example: Documentation for point set Terrain1.dat
| Point ID; X; Y; Z; Description |
| 1; 100.00; 100.00; 100.00 |
| 2; 103.00; 90.00; 99.86; tree |
| 3; 103.00; 110.00; 100.13 |
triangulation
Direct output of the triangles of the triangulation, whereby the triangle number and the three associated coordinates X, Y and Z are output in columns. Areas are also documented.
Creation of the column headings: Triangle, X value, Y value, Z value, projected area, developed area, mean height.
Example: Prism documentation for triangulation Terrain1.dat
| Triangle, X, Y, Z, proj. Area, angled Area, mean height |
| 1,100.000,100.000,100.000 |
| ,103.000,90.000,99.860 |
| ,106.490,97.780,101.550,29.120,30.302,0.960,27.955 |
| 2,106.490,97.780,101.550 |
| ,103.000,110.000,100.130 |
| ,100.000,100.000,100.000,35.780,36.690,1.050,37.569 |
| 3,103.000,110.000,100.130 |
| ,106.490,97.780,101.550 |
| ,112.520,106.020,102.010,51.222,52.066,1.720,88.102 |
After calling the function, the triangles can also be labeled with the triangle numbers used. These are important for an overview plan and the verifiability of the documentation.
Grid
Direct output of the grid cells of the surface, whereby the cell number and the three associated coordinates X, Y and Z are output in columns. In addition, the areas are documented. The mean height and volume are not calculated.
Creation of the column headings: grid cell, X value, Y value, Z value, projected area, developed area.
Example: Documentation for grid network Terrain1.dat
| Cell, X, Y, Z, proj. Area, developed area, avg. Height, volume |
| 1,100.000,79.000,99.510 |
| ,100.737,79.000,99.510 |
| ,100.000,79.737,99.510 |
| ,100.737,79.737,99.510,0.544,0.544,0.000,0.000 |
| 2,100.737,79.000,99.510 |
| ,101.475,79.000,99.510 |
| ,100.737,79.737,99.510 |
| ,101.475,79.737,99.510,0.544,0.544,0.000,0.000 |
| 3,101.475,79.000,99.510 |
| ,102.212,79.000,99.510 |
| ,101.475,79.737,99.510 |
| ,102.212,79.737,99.510,0.544,0.544,0.000,0.000 |
Difference body
Direct output of the prisms of the differential body, whereby the prism number and the three associated coordinates X, Y and Z are output in columns. Areas and volumes are also documented.
Creation of the column headings: prism, X value, Y value, Z1 value, Z2 value, projected area, average height, volume (reference Z1 to Z2).
Example: Prism documentation for differential body Terrain1.dat
| Prism, X, Y, Z1, Z2, proj. Area, mean Height, volume |
| 1,116.874,99.775,100.000,103.196 |
| ,116.874,106.043,100.000,102.159 |
| , 112.520,106.020,102.010,102.010,13.646, -1.785, -24.357 |
| 2,112.520,106.020,102.010,102.010 |
| ,116.510,99.010,103.310,103.310 |
| , 116.874,99.775,100.000,103.196,2.802, -1.065, -2.985 |
| 3,116.510,99.010,103.310,103.310 |
| ,115.290,91.310,101.790,101.790 |
| , 116.874,92.338,100.000,101.904,5.472, -0.635, -3.473 |
After calling the function, the prisms can also be labeled with the prism numbers used. These are important for an overview plan and the verifiability of the documentation.
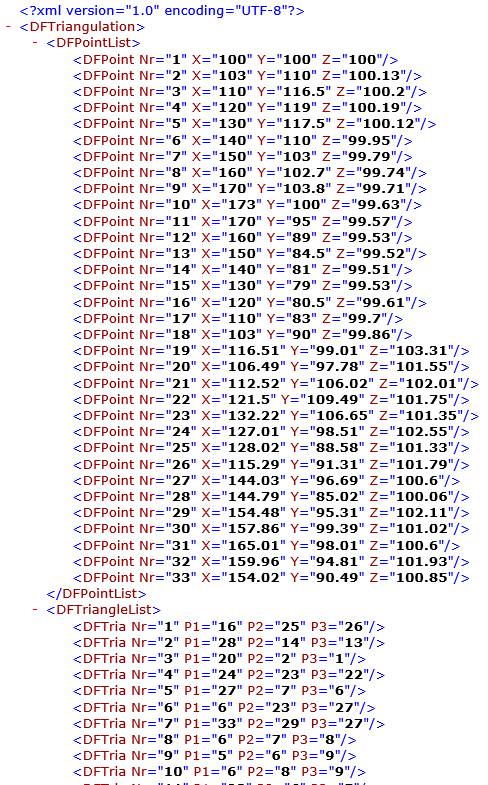
Export as an XML file
For triangulations only
Direct output of the triangles of the triangulation, whereby the points and the three associated coordinates X, Y and Z are output first. This is followed by the output of the triangles with the associated point numbers.

Enter the file name of the file to be created by clicking the […] button.
If the triangulation also contains edges, these are also exported.
Example: XML file for Triangulation Terrain1.dat
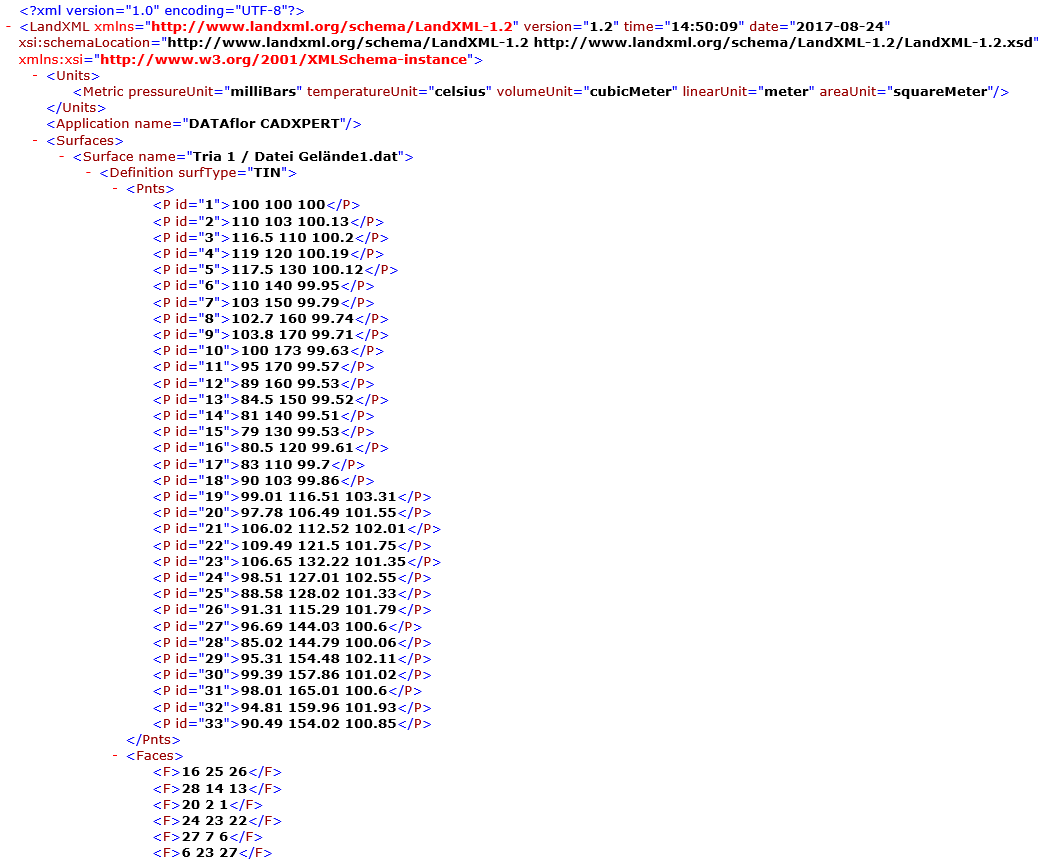
Export as LandXML file
For triangulations only
Direct output of the triangles of the triangulation, whereby the points and the three associated coordinates X, Y and Z are output first. This is followed by the output of the triangles with the associated point numbers.

Enter the file name of the file to be created by clicking the […] button.
If the triangulation also contains edges, then these are also exported.
Example: LandXML file for Triangulation Terrain1.dat
Export axes
With this function you can axles export in LandXML format. These are sometimes required as additional information for the machine control.
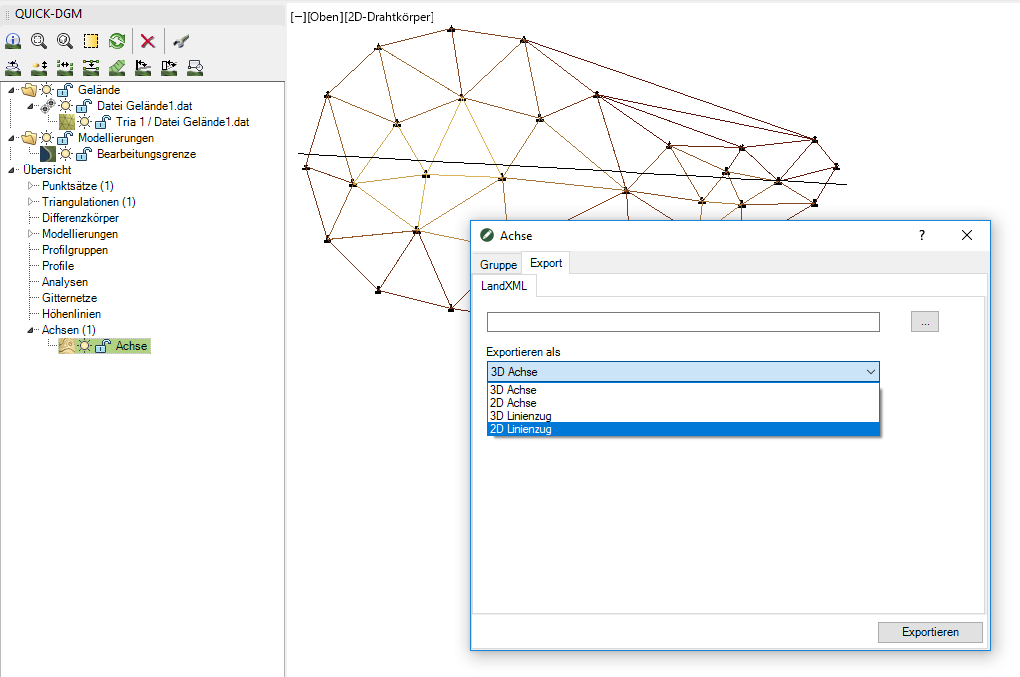
2D or 3D polylines can be recorded as axes by dragging and dropping them onto the node axles pull.
| 3D axis | Is written as an "alignment" in the LandXML file. The "alignment" consists of a 2D line (CoordGeom) and the associated height information (profiles). |
| 2D axis | Is written as an "alignment" in the LandXML file. The "Alignment" only consists of a 2D line (CoordGeom). |
| 3D polyline | Is written as a "PlanFeature" in the LandXML file. The "PlanFeature" consists of a 3D line (CoordGeom). |
| 2D polyline | Is written as a "PlanFeature" in the LandXML file. The "PlanFeature" consists of a 2D line (CoordGeom). |
Export of REB selection
With this function, DTM data such as Point sentences and triangulations can be exported as REB files.
If a triangulation consists of several sets of points or edges, then these are combined to form a set of points or edges during the export.
The data types can either be created as individual files (data types) or in a file as a REB data record. This REB data record can then contain several types of data.
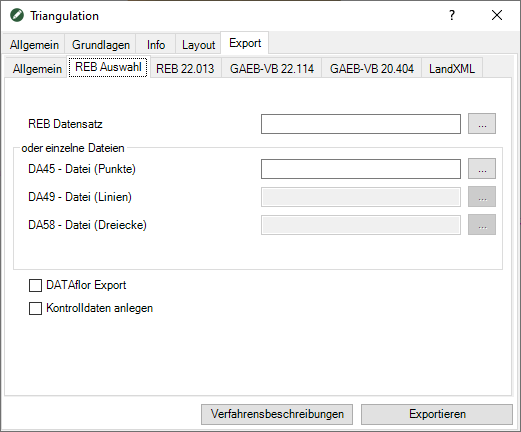
Enter the file name of the file to be created by clicking the button [...] . click
A DA49 or DA58 cannot be created without the associated DA45.
Is the option DATAflor Export activated, then several point or edge sets are created during the export if the exported triangulation contains several point or edge sets.
With the option Create control objects AutoCAD points (DA45), 3D polylines (DA49) and 3D surfaces (DA58) are created which can be used to check the created DTM data. The data is created on separate layers.
Export to GAEB / REB process description
With this function, DTM data such as Point sentences, Triangulations, Modeling, Difference body and Profile groups can be exported according to various process descriptions.
If a triangulation consists of several sets of points or edges, then these are combined to form a set of points or edges during the export.
The data types can either be available as individual files (data types) or in a file as a VB data record. This VB data record can then contain several types of data.
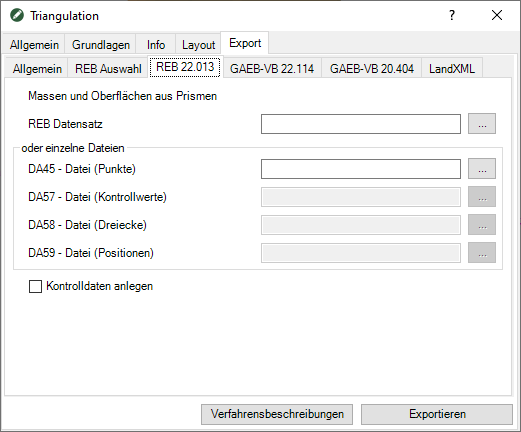
Enter the file name of the file to be created by clicking the button [...] . click
With the option Create control data AutoCAD points, 3D polylines and 3D surfaces are created that can be used to review the created DTM data. The data is created on separate layers.
More information about the used GAEB / REB process descriptions you can use the button [Process descriptions] . call
According to the REB process description, the current Line numbers the triangular mesh only 4 digits to disposal. As a result, if there are more than 9999 triangles, the REB-compliant export is only carried out incompletely.
You can have one not Perform REB-compliant export. In this case, another digit is used so that up to 99999 triangles can be exported.
According to the REB process description 21.013 make only 3 decimal places permissible. Because of this, inaccurate values can arise compared to the CAD quantity.