Table of Contents
Create graphics
Description
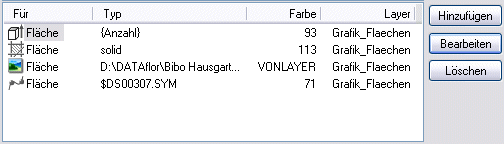
Graphics properties are in the tab Schedule defined in the lower area. First a graphic variant for which this assignment applies must be marked above, then below with [Add] assigned a new graphic. After creating the graphic, it is displayed in the lower area of the tab.
Features
The following symbols are used:
 | Line type |
 | hatching |
 | color gradient |
 | Block, Block line |
 | single raster graphic, linear raster graphics, flat raster graphics |
 | a pillar. |
 | Object height |
 | Symbol line |
 | Multiline |
 | Google Earth graphic |
Graphics can be assigned at group or object level. The graphic property is automatically inherited by all subordinate groups and objects when it is created.
The symbols are shown in color on the level on which the graphics are created.
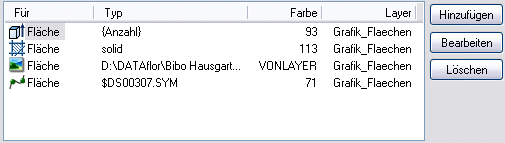
At the level of the subordinate groups and objects, the symbols are displayed in gray in the Graphics tab. This indicates that the graphic was inherited from a higher level.
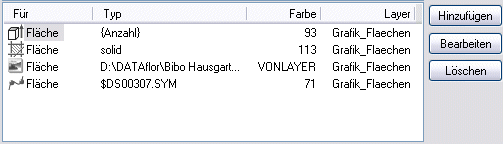
The graphic can also be edited at the level of the subordinate groups and objects. In this case the icon changes from gray to color and this setting is adopted. A change at a higher level no longer affects this changed property.