Table of Contents
Google Earth graphic
Description
With the help of the Google Earth graphic you can quickly and effectively assign the graphic to objects or groups in the drawing with the option of then assigning it to Google Earth exporties.
For example:
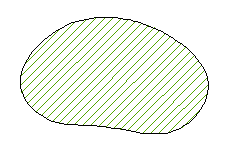
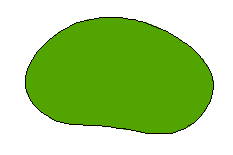
| Representation in DATAflor CAD: hatching LINE | Representation in Google Earth: hatching Solid |
 |  |
Application
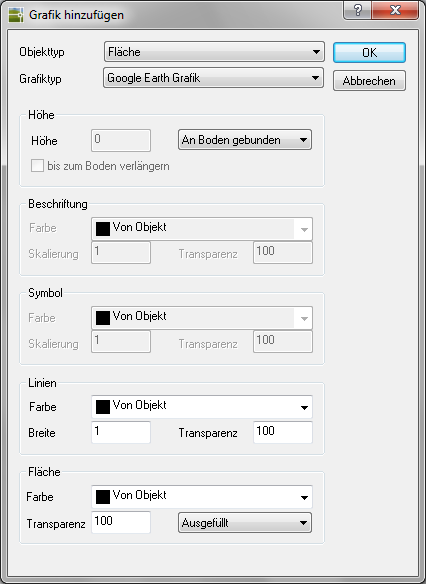
- Choose the Property Type and Graphic type Google Earth graphic .
- You can enter values for all object types in the area Height set to extrude the geometric shape.
There are three Height adjustment options:
Bound to the ground - By default, this option is set for all objects. In this case the height of the object is tied to the ground, so there is no height value in the field Height permissible. This will ensure that the object stays fixed on the floor.
Relative to the ground - When this option is selected, the height of the object is relative to the actual floor height of the view. For example, if you set the elevation for an object in Venice to nine meters, the object will be nine meters above sea level because Venice is at sea level. However, if you place the same object over Denver, the height of the object will be 1616 meters because the height of Denver is 1607 meters.
Absolut - When this option is selected, the height of the object is relative to sea level. If you have switched on the terrain display in the above example and left the height at nine meters, but the height type on Absolut the icon would no longer be visible in the view because it would actually be below Denver ground level.
You can adjust the height by entering a value in meters in the field Height .
Only whole numbers (values in meters) are possible in Google Earth. The values entered here are mathematically rounded for use in Google Earth.
Once you have set an altitude value, you can use the option extend to the bottom Create side walls. When single point objects are drawn with sidewalls, a single line appears from the surface of the earth to the object. When a path with sidewalls is drawn, a geometric shape is drawn from the surface of the earth to the object. If an area is extended to the ground, it is displayed as a solid in Google Earth.
- In this example, the graphic is to be assigned to an area.
In the area Area you can choose the color, transparency and fill type.
Google Earth cannot display hatching patterns, so all graphics are shown there as full-area hatching (see Solid).
In the area lines The settings for color, width and transparency are available to you (also for the route object type).
For the piece object type, on the other hand, in the areas Label and Symbol Color, scale and transparency can be adjusted. - After you have made all the settings, the dialog can be opened with [OK] getting closed.
- The last step is to save the change
 .
.
Since this is only a graphic for use in Google Earth, the graphic remains in DATAflor CAD invisible.
In the object manager of DATAflor CAD the possibility with the function Transfer graphic automatically derive Google Earth graphics from existing graphics.
(Source: Text is partly from the Google Earth user manual)