Table of Contents
a pillar.
Description
You can with the help of the a pillar. Quickly and effectively assign column graphics to objects or groups in the drawing.
For example: Column height = 5% of the area + radius = 0.7 degrees
Application
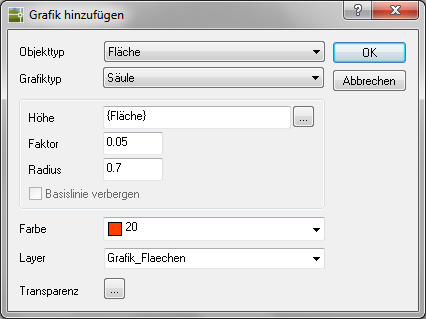
- Choose the Property Type and Graphic type a pillar. .
- In the field Height you can work with fixed values (eg 4) or with object dependencies (eg {area} +10). Of the factor can be used for an increase or decrease. In the example, the height is = {Area} x 0.05. Thus, for example, an isometric view can be used to show which areas are the largest. Of the Radius defines the cross section of the column.
- Nachdem Color and Layer have been selected, the dialog can be opened with [OK] getting closed.
- The last step is to save the change
 .
. - You can also use a Transparency define for the object in which you click [...] click (at DATAflor CADXPERT available from AutoCAD 2011).