Table of Contents
Table
Description
DATAflor distinguishes between the tables in the areas Table header (Header) and the Data area. These two areas are each different in terms of their usability and layout.
In individual cases Colors, layout and User guidance the tables differ from the illustration in the following chapters.
Colors
The following actions are stored with colors in tables:
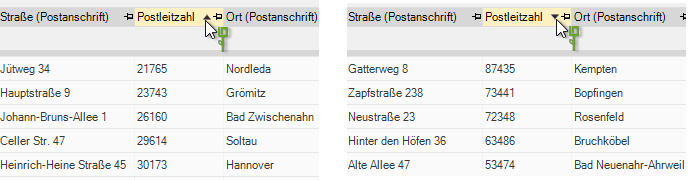
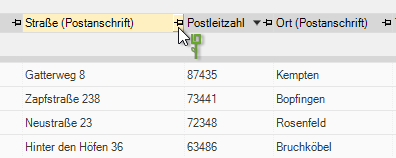
- When you mouse over a column heading, it is highlighted in dark yellow.

- When you mouse over the beginning of a line, it is highlighted in green.

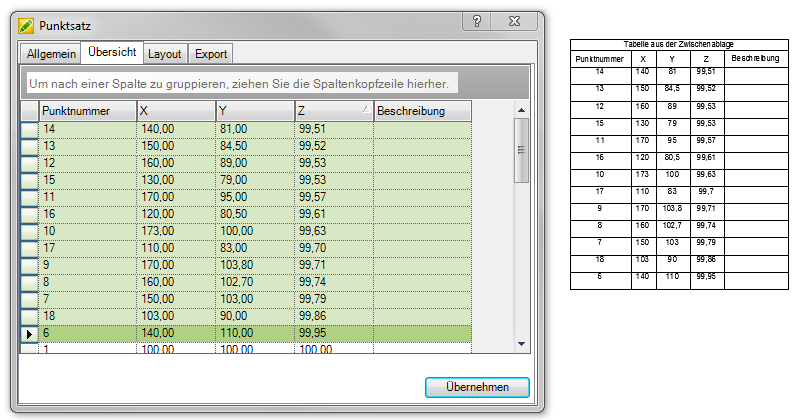
- When you select a line, it has a green background. The beginning of the line is displayed in green with a black triangle.

- When multiple lines are selected, they are displayed in light green and the last line selected in green. The beginning of each line is displayed in green, with the beginning of the line selected containing a black triangle.

layout
The layout specification in the table header includes the following points:
- The font in the tables is Microsoft San Serif at 8,25;
- The table lines are dotted black;
- Column widths can be adjusted automatically, by double-clicking or manually;
- The table width is variable and can change change;
- Multi-selection of several columns is not possible;
- The text content is either left or right justified;
- The line width can be increased or decreased manually. This selection affects all rows of the table;
- Multiple selection of several lines is possible.
Sort by columns
By clicking on the column header you will get an ascending or descending sort based on the selected column. The sorting always refers to the last column selected.
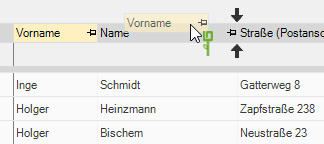
Move columns
Columns can be moved horizontally by clicking and holding.
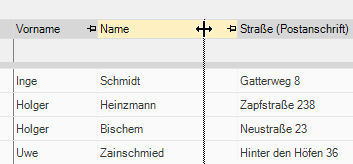
Enlarge columns
To enlarge columns, you can simply drag the column headers wider. To do this, left-click on the edge of the column header, hold down the button and drag the column to the desired width. To adapt the column width to the content, you only have to double-click on the right-hand edge of the column header with the left mouse button.
Freeze columns
The column can be fixed using the pin on the right-hand side in the column header. As soon as you click on the pin, the column on the left is inserted and is also visible when the horizontal slider is moved to the right. The gap Symbol is fixed automatically.
Grouping by columns
You have the option of sorting the data shown in the table according to the columns. To do this, click with the left mouse button on a column header, hold the key down and drag it into the area above the tables. As soon as you release the key there, the table will be sorted. You can sort the table according to several columns.

The setting of the column layout is individual for each table and is saved on a user-specific basis and remains in effect until the table display is edited again.
Column selection
You can call up the column selection by clicking on the plus in the upper left corner of the table. Here you can add or deselect columns. The columns are grouped according to their purpose. You can add / deselect entire groups or individual columns. The settings are adopted when the dialog is closed.

Layout templates
By clicking on the plus in the upper left corner of the table you can go to the tab Layout templates save and load the adapted representation of the table (e.g. for an overview, for data export or list printing).
For this purpose, the Derive the layout template from the current table, save, duplicate, delete, export, import and the Apply layout template to current table.

Each table remembers the last active state of the layout.
Column filter
filter by entries
The display within the table can be restricted in all columns by defining filter criteria. All are available as filter criteria entries used in the column to select.
To filter the entries displayed in the table according to the criteria of a column, click in the row below the column header ![]() .
.
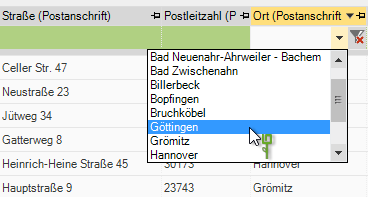
All entries already used in the column are available as filter criteria in the selection menu. If you select the desired entry, all other entries are hidden.
filter by entering text
In the table, you can filter the data in all columns by entering a text.
To filter the displayed entries in the table for a term in a column, click in the text line below the column header and enter the filter term.
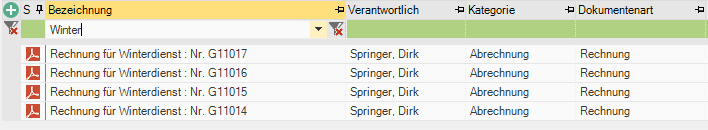
Im Example only those documents are then displayed with their designation Winter contains.
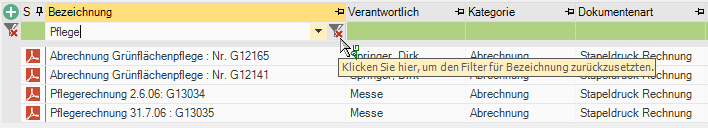
Switch off the filter
You have two options for resetting the set filters:
- To one individual column filter to delete, move the mouse pointer to the line below the column header. Then click the symbol on the right
 .
. - Um all filters To remove, click on the left in the column filter row.
User guidance
The tables have the following user functions:
- Tab You can click through table fields or switch lines with the button.
- With Shift +Tab Button to switch to the previous table field.
- With the Arrow keys the cursor (input pointer) can be moved in the table fields. You can also open and select lists in the fields, change the date in calendars or change rows and columns within the table.
- With Enter is switched to the next table field or the dialog is closed.
- The table contents are partially editable. The field in the selection either automatically highlighted in blue is displayed or the cursor (input pointer) is placed at the end of the content.
- The display of the table can be partially sorted by columns using drag & drop (click and drag).
- Everyone's lines DATAflor Tables can be selected using the line selector (start of line) with Ctrl + C copied to the clipboard and with the command DFCTAB in DATAflor CAD can be inserted.