Table of Contents
Plant legend
Description
From the Plant manager legends for planting plans can be created automatically. This type of legend only takes plant objects into account.
Features
You have the option of creating legends for each drawing node in the Plant Manager. It is called up with the right mouse button on the desired node.
Only nodes under the category drawing can be chosen for legends.
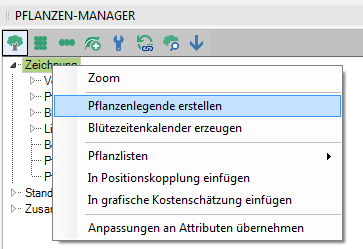
By calling the command Create plant legend the plant data of the selected node is loaded and the dialog opens. Your last entries are retained.
Contents tab

| Title | The title of the legend is by default with Plant legend filled. You can give the legend any title you want. |
| Info | The content of this field is shown in the legend under the title. If no text is entered here, this line is omitted in the legend. |
| Table | All available plant information is shown in the table. All current ones are available for editing Editing functions for tables is available for storage, management and analysis. |
| Update preview | Clicking the button loads the adjusted settings of the dialog and updates the preview. Within the preview, the display can be enlarged / reduced by turning the mouse wheel and the display can be moved in the window with the mouse wheel pressed. |
Settings tab

| Color | Select which color settings should be used for the graphics in the legend (from object, color groups, leaf color, flower color, months with flower and leaf aspects). |
| View / supervision | Select whether the graphics in the legend should be displayed from above or from above. |
| Types of representation | Select the display type in which the graphics are shown in the legend (picture, block, symbol, filled symbol, texture, hatching, solid). |
| Show solitaire graphics | You have the option of displaying extensive plantings with their solitary graphics. |
| Select display from view | In the model area, all graphics settings are adopted from the drawing. All graphics are displayed in the legend as they can be found in the drawing. If you insert the plant legends in the layout and there are several view windows with different display types in your layout, you can select the view window that is to serve as the basis for the graphic settings after pressing the button. |
| Display automatically | The size of the displayed Schedule or Pictures is calculated automatically. It is based on the text size and is therefore variable. [Select height / width]: The height and width of the displayed graphics or images are selected by specifying two points. The values then appear in the fields Height and Width. These input fields can also be used to manually enter the height and width of the graphic display. |
| Scaling factor for graphics | The graphic is scaled with the entered factor. |
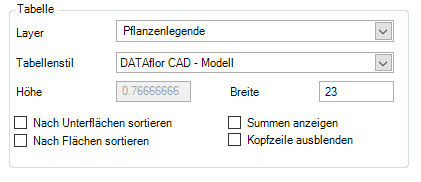
| Layer | Select a layer on which the plant legend should be created. |
| Table style | Select the table style you want for your plant legend. |
| Height / width | Select the height and width of the legend. |
| Sort by sub-surfaces | You have the option of having your legends grouped according to the sub-areas in your drawing. Plants that are created in several sub-areas are thus also displayed several times in the legend. |
| Sort by area | You have the option of having your legends grouped according to the areas in your drawing. Plants that are laid out in several areas are thus also displayed several times in the legend. |
| Show totals | Displays the totals of the grouped columns in the plant legend. |
| Hide header | Hides all headers in the plant legend. |
About the command TABLE STYLE you can create a new table style or an existing table style Bearbeiten.
The predefined DATAflor Table styles is the font Arial assigned. This supports the use of exponents (m², m³).
With confirmation by [OK] the dialog closes and you can select an insertion point for the plant legend. over [Abort] the dialog is closed.
Update
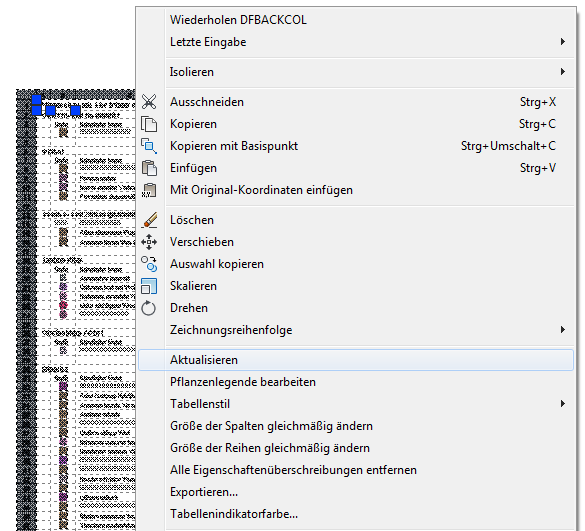
If you have added new plants to your drawing after creating the plant legend or if, for example, the graphics of the plants have changed, it is necessary to update the legend.
- Select the legend in the drawing or in the layout.
- Click the right mouse button and select the menu item Update .

- New plants and / or graphics are included in the legend.
Edit plant legend
If you want to edit a legend that has already been created, for example to add or remove columns, to display sums or to adapt the way the graphics are displayed, you need to edit this legend.
- Select the legend in the drawing or in the layout.
- Click the right mouse button and select the menu item Edit plant legend .
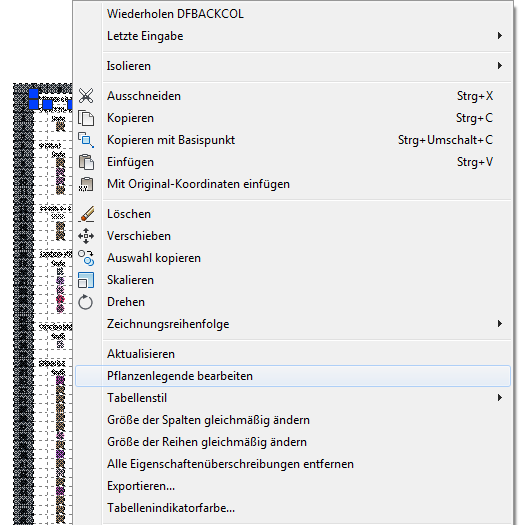
- The edit dialog opens again and you can make the desired settings.
- With confirmation by [OK] all changes are adopted in the existing legend.
