Table of Contents
Create legend
Description
From the Object manager legends can be generated automatically. These legends are associative, ie changes in the Object Manager are updated automatically. The selected group in the Mass tree, because the function only relates to the subordinate groups and objects.
Features
Select the desired group in the Mass tree and then call via the Komtext menu Tools> Create Legend open the dialogue.
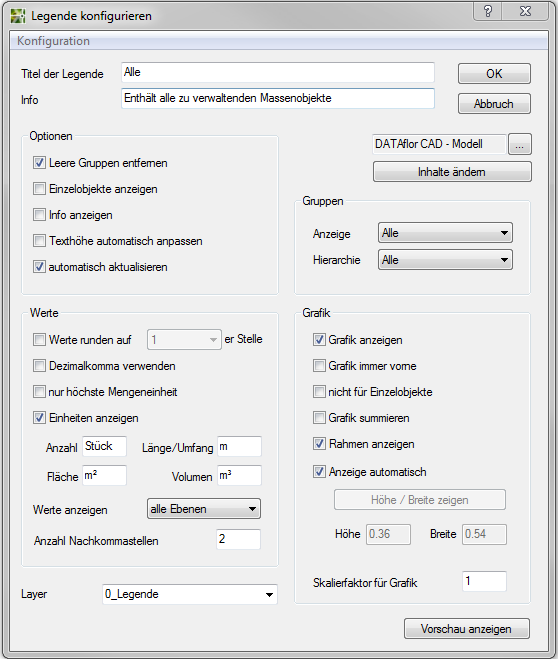
In dialogue Configure legend presettings have already been made. If you would like to make adjustments, you will find further information on the individual areas in the corresponding chapters Options, Groups, Values and Schedule.
For the Legend title is automatically the current group name from the Object manager used. Any entry can also be made here.
The Info field can be used as a subtitle. The display of the information from the is preset Object manager.
With [OK] the legend is inserted into the current drawing as a table.
[Cancellation] ends the function for creating a legend and switches back to the dialog.
For the legend it is Table style DATAflor CAD layout preset. It is optimized for use in the layout. This table style and the table style DATAflor CAD model are created automatically if they do not already exist.
With the button [...] takes you to the selection of the table style.
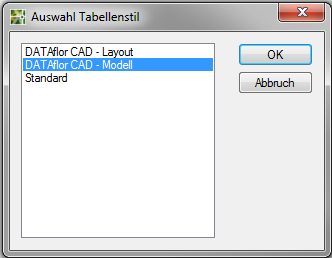
In dialogue Table style (TABLE STYLE) you can create a new table style or an existing one Edit table style.
The predefined DATAflor Table styles is the Font Associated with Arial. This supports the use of exponents (m², m³).
With the button [Change content] the contents of the table can be defined.
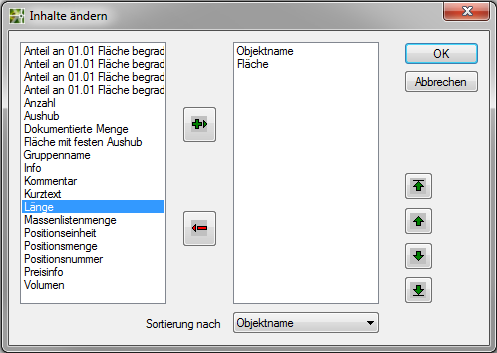
The columns are preset Object name and Area. Furthermore, the attributes Quantity, Documented amount, group name, Length and Volume selectable. In addition, the user-defined Attribute (please refer Formulas & Lists) are listed if they have already been assigned to objects in the mass tree. Does the object manager contain a Position coupling, additional columns are displayed. The columns in the table are sorted using the arrow keys (top> bottom corresponds to left> right).
With Sort by the column is selected based on which the objects are then sorted within the legend.
The legend is stored on the selected or newly created layer. The default is the layer 0_Legend.
[Show Preview] expands the existing dialogue Configure legend. This part shows a preview of the legend with the current settings. Changes except for those in the input fields are displayed immediately. When changes are made in the input fields, the button is [Update preview] .
Configuration menu
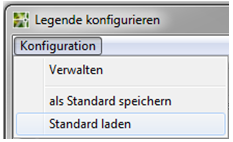
With save as default the current settings are saved. This standard now applies to everyone new Drawings as default.
Manual changes are made by calling Load standard the default setting loaded.
With Administer can in addition to the configuration Standard further configurations can be created.
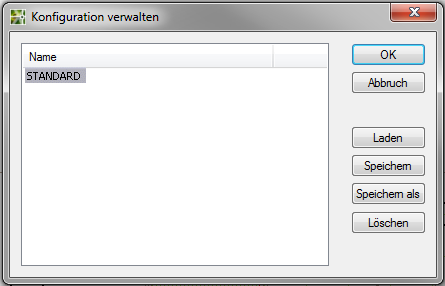
| [OK] | Applies the changes. |
| [Cancellation] | Discards all changes. |
| [Load] | Loads a saved configuration that was previously marked in the list. |
| [To save] | Saves the current settings in the selected configuration. |
| [Save as] | Saves the current settings under a defined name. The new configuration is added to the list. |
| [Clear] | Deletes a saved setting. |
Use the command to edit the legend Edit legend.
Options
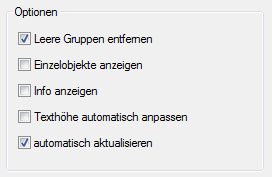
| Remove empty group | Groups from the Object managerto which no objects have been assigned are not displayed in the legend. |
| Show individual objects | All in Object manager assigned objects are listed in the legend. If this option is deactivated, the individual objects are not displayed in the legend, but they are included in the calculation of the total. This can mean that the value of the total row does not match the total of the group. |
| Show info | The text from the Info field is displayed under the title of the legend. |
| Adjust text height automatically | The text heights of the groups and individual objects are calculated using an internal size factor so that each subordinate level is smaller than the superordinate level. If this option is deactivated, the data is inserted in the legend with a uniform text height. |
| update automatically | Quantities and graphics from the Object manager are automatically updated when changes are made. For example, when another object is detected or another graphic variant is activated. |
Groups
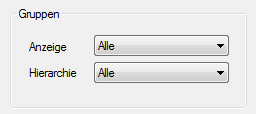
| Advertising | Controls the display of the objects depending on the selected group. All shows all objects from the Object manager With 1st level only the first level below the highlighted group is displayed. The selection of 2st level indicates another level. |
| hierarchy | Controls the display of the hierarchy objects. With All all groups are arranged hierarchically. No creates all objects one below the other. 1st level: One level is indented. 2st level: Two levels are indented. |
Example of display

Example of hierarchy

Values
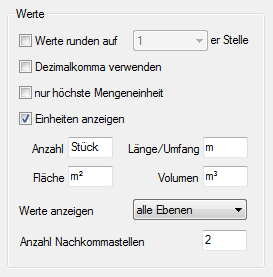
| Values round up | With this option, the displayed values can be rounded up to a specific place (e.g. 10s).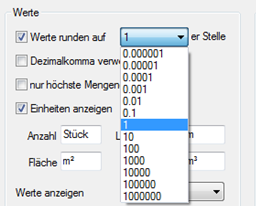 |
| Use decimal point | Instead of DATAflor CAD used a decimal point as a decimal point. |
| only the highest unit of measure | Only the highest unit of measure is displayed in the legend: number, length / circumference, area or volume. |
| Show units | Allows you to view the units, which include attributes such as number, length, area, and volume. The units of user-defined formulas are also displayed, if applicable. |
| Show values | 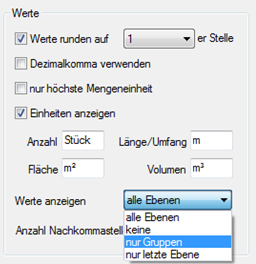 all levels: The sums of subordinate objects and groups are formed on all levels. save: No sums are formed. groups only: Totals are only displayed for the groups, not for individual objects. only last level: Totals are only created for the groups under which there are objects directly. Parent groups do not receive any totals. The total of all objects is created in a further line, as long as the selection is not made save is hit. |
| Number of decimal places | Controls the display of the decimal places. The default value is 2. |
Schedule
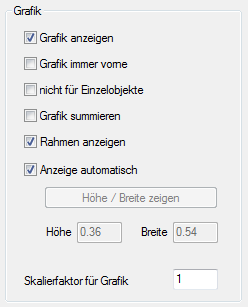
| Show graphic | Controls the display of the graphic in the legend. |
| Graphics always in front | All graphics are left-justified one below the other in the legend. |
| not for single objects | The graphics assigned in the object manager are not listed for the individual objects. |
| Sum graph | In the same way as the object manager, the higher-level graphic is transferred to subgroups and shown in the legend. If this option is deactivated, only the graphic that was precisely assigned to the group is displayed in the legend. |
| Show frame | A frame is created around the graphic. |
| Display automatically | The size of the graphic display is calculated automatically. It is based on the text size and is therefore variable. [Show height / width]: The height and width of the graphic display are selected by specifying two points. The values then appear in the fields Height and Width. These input fields can also be used to manually enter the height and width of the graphic display. |
| Scaling factor for graphics | The graphic is scaled with the entered factor. The basis for the calculation is the setting made in the Object manager assigned graphic. |
<WRAP round tip The representation of the graphics in the legend corresponds to the graphic variants in Object manager. If the graphic variant is activated there, it is also displayed in the legend; if the graphic is deactivated, it is hidden in the legend.