Table of Contents
Slope manager
Command: GMMANAGER
Description
In order to avoid dangers and damage, rainwater must drain off quickly. Calculating the necessary gradients by hand can take a long time. With the DATAflor Slope manager, these slopes can be created quickly and reliably, for example for the drainage planning of sealed surfaces or as a design aspect.
You need (at least two) planning points for a slope. The points are connected to one another and are then available as a point list.
Application
Features
After calling the function Slope manager allows you to create new points for a slope by deriving the height of objects, specifying the height, slope or height difference, or inferring an existing drawing object.
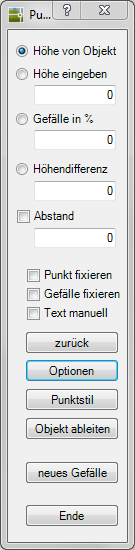
| feature | Description |
|---|---|
| Height of object | The new point uses the height of the selected object. To get the exact height on the object, the object snap is activated. The slope is calculated automatically. |
| Enter the height | The entered value is used as the point height of the following points. The slope is calculated automatically. |
| Slope in % | The entered value is used as the slope of the following point connections. The height of the new points is calculated automatically. |
| Height difference | The new point is higher than the last point by the value entered. The slope is calculated automatically. |
| distance | In addition, the distance from the last to the following point can be specified. Depending on the option selected for creating points, the slope or height of the new point is automatically calculated. |
| Fix point | The following point is marked as pinned. The Z-value is protected against processing. The fixation can be removed in the point list. |
| Fix the slope | The following slope is marked as fixed. The slope is protected against processing. The fixation can be removed in the point list. |
| Text manually | The position of the point labeling can be reset for each point. If this function is deactivated, the settings from the Options (see Chapter Gradient options) is used. |
| back | The last point is reset. |
| Options | Opens the Optionsin which the settings for labeling and dimensions can be made. |
| Point style | Opens the Point Style window. The point symbol and the point size can be defined here. |
| Derive object | If an object is selected in the drawing, the heights of the object are used and the slopes are calculated. With this object detection, the type of derivation can also be determined: bases - Standard Distance - Points are created at a defined distance Segments - Object is divided in a specified number and points are created accordingly |
| new gradient | With this function several slopes can be created one after the other. For this purpose, a point list is generated for each slope. |
| Ende | Completes the recording of the slope points and opens the Slope Manager window with the last point list. |
A point can be linked to any number of points and with every change, the slope, distances and heights are automatically updated and labeled. This means enormous time savings.
Will be an already for a new gradient existing slope point selected, the new point can be created as a dependent slope object. This means that the coordinate of the new point is identical to that of the original point.
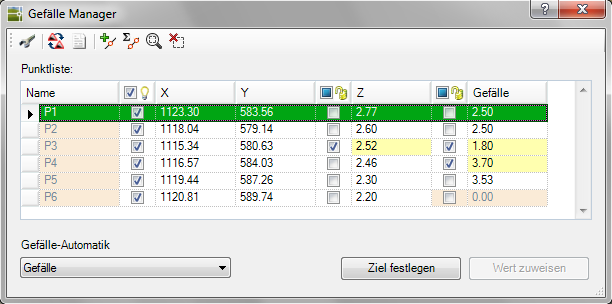
Point list
In dialogue Slope manager the points of the last slope created are displayed in a point list. After selecting one or more points, these can be edited.
Features
 | Edit options: Opens the options (see chapter Gradient options), in which settings for labeling and dimensions can be made. |
 | Choose slope: Saves the changes to the current slope and prompts you to select a new slope object. Once selected, the new point list is displayed in the Slope Manager dialog |
 | Export point list: Save the point list as CSVFile. This can then be used, for example, for setting out in the area. |
 | Add points: Adds one or more points to the slope. To do this, the Gradient Manager dialog is closed and the next point is requested. This is then added to the list. |
 | Select points: One or more points can be selected in the drawing. These points are automatically marked in the point list. |
 | Zoom selection: Zooms in on the points marked in the point list. |
 | Delete selection: The points marked in the point list are deleted. The point numbers are then automatically updated. |
All slope points are listed and can be found in your visibility be changed. The values for X, Y, Z and for that gradient can be changed. In addition, the values for Z and for the slope fixed and thus be locked against changes. Fixed values are marked in color in the point list and in the drawing.
To change the values, click in the corresponding field, change the value and confirm your entry with Enter-Button. All dependent values, if not fixed, are automatically recalculated.
The points in the point list are selected as in Windows Explorer. Point areas can be accessed via the Shift Button must be highlighted. Several single points are selected with the key Ctrl selected.
Automatic slope
A slope or a height can be calculated automatically for a selected point or for a point range.
Application
- Either select a point or mark a point range in the point list.
- Select the automatic slope calculation: slope, height (same slope) or height (same height difference). The individual calculation methods are explained below.
- The a chosen point Can you do this Set a goal. Select a point on the slope in the drawing and enter the value required for the calculation. The calculation is then carried out.
If there is a dependent slope, a calculation is only possible from the base slope to the dependent slope and not vice versa.
At a marked point area can you do one Assign value. Enter the value required for the calculation. The calculation is then carried out.
With the calculation methods height (same slope) and height (same height difference), the value describes the difference between the first and the last selected point. The intermediate points are calculated automatically.
Calculation methods
| gradient | A gradient is specified. The z-values of the points are recalculated. |
| Height (same slope) | Enter the height difference between the first and the last selected point. The Z-values of the intermediate points are calculated with a constant slope. |
| Height (same height difference) | Enter the height difference between the first and the last selected point. The slopes of the intermediate points are calculated with the same height difference. |
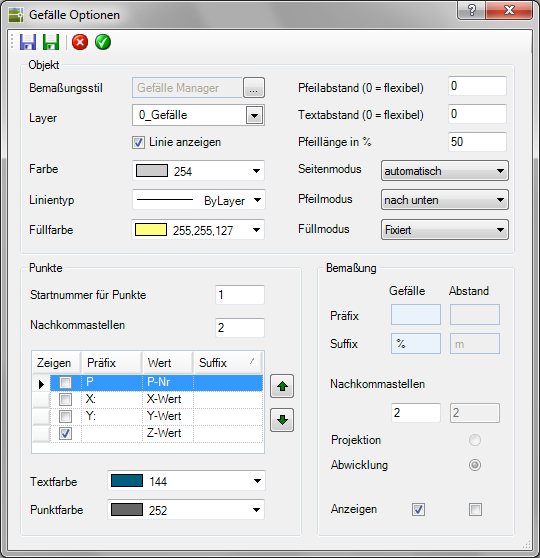
Gradient options
In dialogue Gradient options the settings for labeling and dimensions can be changed and saved in different configurations.
toolbar
 | Manage settings: Opens the dialog Slope configurations, in which the settings for labeling and dimensions can be loaded, saved or deleted. |
 | Save as default: The saved settings are now applied to all new Slope objects used as default. |
 | Discard settings: Ends the dialog Gradient options without saving the changes. |
 | Save settings: Closes the dialog Gradient options and uses the changes for the current slope object. With another call of the function Slope manager the settings saved as default are then used again. |
Object area
| Dimension style | Opens the selection of the dimension style. A new dimension style is used for the slope manager function Slope manager which is used as a default. Additional settings can be made in the dimension style manager, e.g. for text alignment. |
| Layer | The slope objects are created on the entered layer. |
| Show line | This option controls whether the connecting lines between the points are displayed. |
| Color | Selection of the color for the representation of the line between the points. |
| Line type | Selection of the line type for the display of the line between the points. |
| Fill color | Selection of the color for the background of the values for slopes and points. |
| Arrow spacing | Specifies the distance between the arrows and line labels and the connecting line. The objects are offset parallel to the line at the specified distance. The value 0 is flexible. It depends on the selected objects and the text size. With a value of 0.0001, the objects are almost on the line. |
| Text spacing | Specifies the distance between the point label and the point. The label is offset in the specified distance in the X / Y direction. |
| Arrow length | Defines the length of the arrow depending on the distance between the points. |
| Page mode | Specifies where the arrow and label of the line should be placed. Links, right-wing or Automatically (alternately) depending on the direction of the drawing. |
| Arrow mode | Determines whether save Arrows, arrowheads down or up show (depending on the point heights) or whether beide Arrow directions are displayed. |
| Fill mode | Specifies whether the fill for fixed Values, discord or nie should be used. |
Area points
| Starting number for points | The numbering of the new Point lists are consecutive, starting with the number specified here. |
| decimal | The accuracy of the X, Y and Z values can be determined by specifying the decimal point. |
| Object table | The point labeling can be defined here in detail: Visibility, prefix and suffix for point number, X, Y and Z value. |
| Text color | Selection of the text color for the point labeling. |
| Point color | Selection of the point color for the point symbol. |
Dimension area
| Prefix / suffix | A prefix and suffix can also be specified for labeling the slope and distance. |
| decimal | The accuracy of the values for slope and distance can be determined by specifying the decimal point. |
| Projection / processing | The distance can be labeled in the projection (2D) or in the Processing (3D). |
| Show | This option controls whether the slope and clearance labels are displayed. |