Table of Contents
Coordinate grid
Command: DRAWCOORD
Description
This function creates a coordinate grid with the removal of the X and Y values. This can, among other things, facilitate the checking of coordinate values in the quantity verification for area calculations that are carried out and documented according to Gauß-Elling.

Application
- After calling up the command, you will be asked to use the mouse to define an area in the drawing in which the grid should be created. Alternatively, coordinates can also be entered.
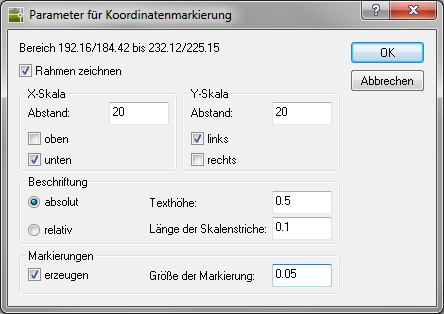
- After the area definition, the following dialog opens in which the Parameter (see below) can be defined for the creation.
- After leaving the dialog with [OK] the grid is inserted into the drawing.
Features
The following parameters can be changed:
Draw the frame: A check mark in the box determines whether a frame should be defined around the selected area.
Area X and Y scale: Lays the distance between the X and Y values and defines the sides on which the values are to be displayed: above, below, left-wing or right-wing.
Area Label: About absolut and relatively set whether absolute coordinates or relative axis labels are to be used. Continue to enter the Text height for the lettering and the Length of the tick marks
If you enter the value 0.0 for the scale length and specify a text height greater than 0.0, the scale length is calculated automatically depending on the text dimensions.
Area Markings: When activated, draws crosses at the intersections of X and Y coordinates within the selected area in order to provide an orientation option. The Size of the mark can be set in the input field.