This is an old version of the document!
Table of Contents
Key figures / evaluations
Key figures / evaluations
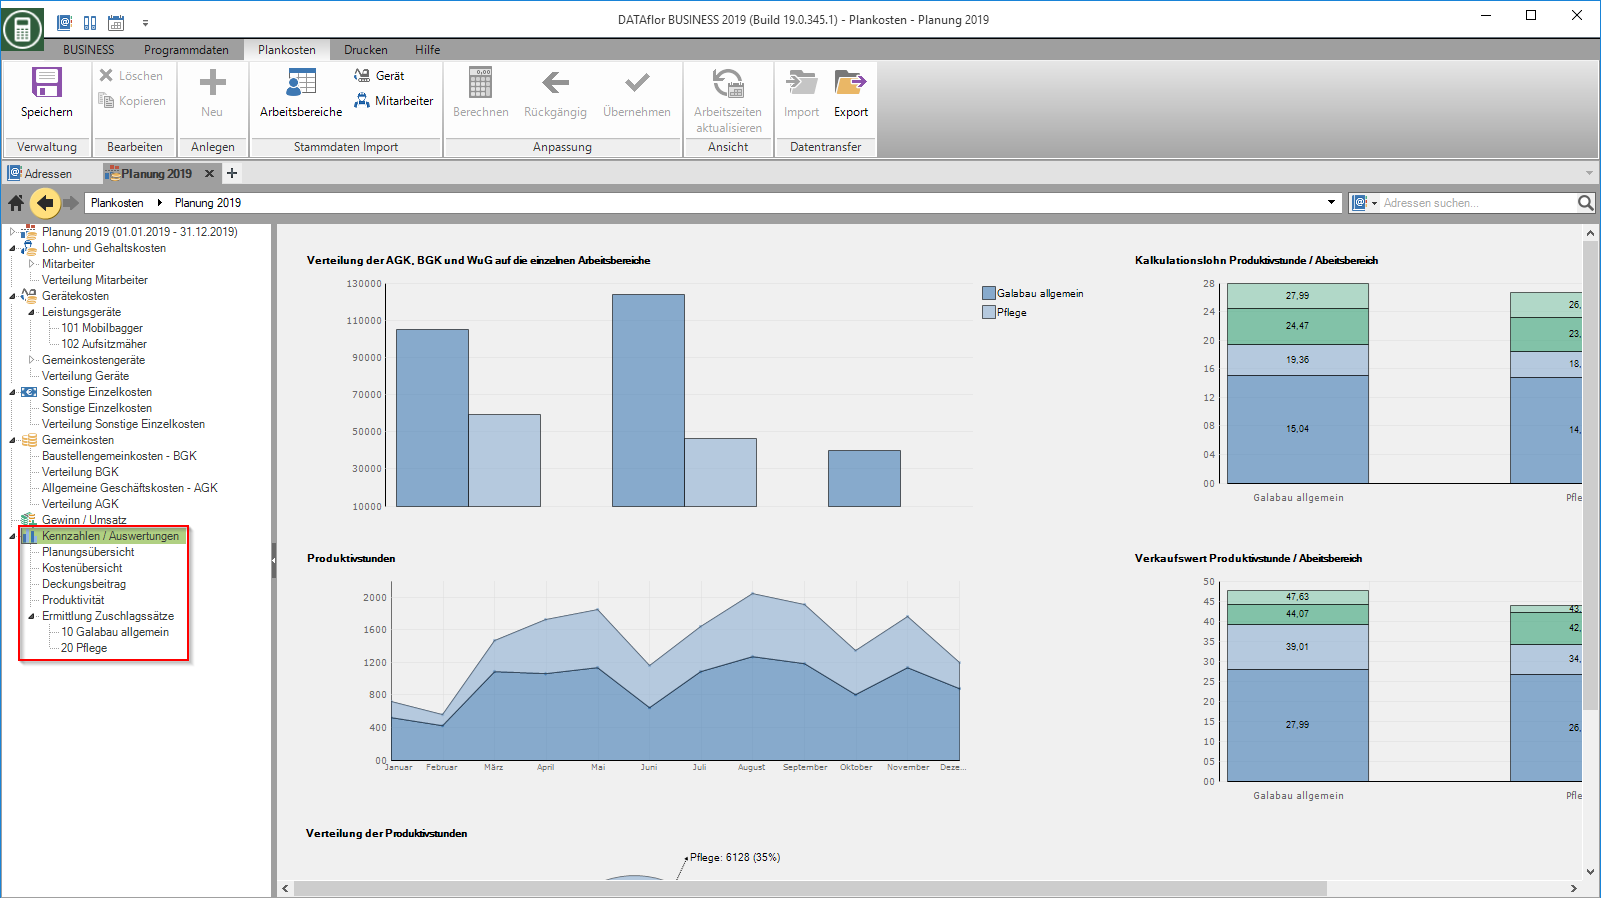
Select the entry in the directory tree Key figures / evaluations, graphic representations of selected key figures are displayed on the right-hand side of the screen.
- The work areas are shown in the color you specified in the settings for Work areas - cost centers have defined.
Planning overview
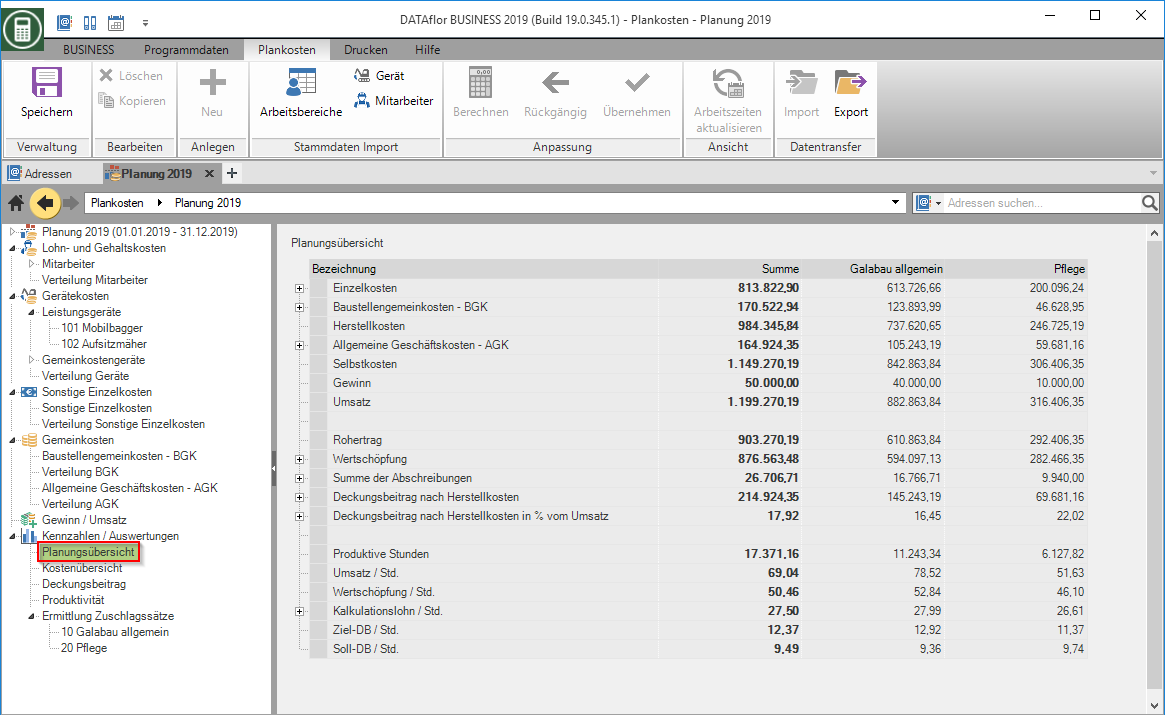
Select the entry in the directory tree Planning overview, the recorded costs of planning for the entire company and each work area are summarized on the right side of the screen. In addition, important key figures such as contribution margin, added value, productive hours, sales / hour. and much more for the entire company and all work areas.
You can also use the Print planning overview.
Cost overview
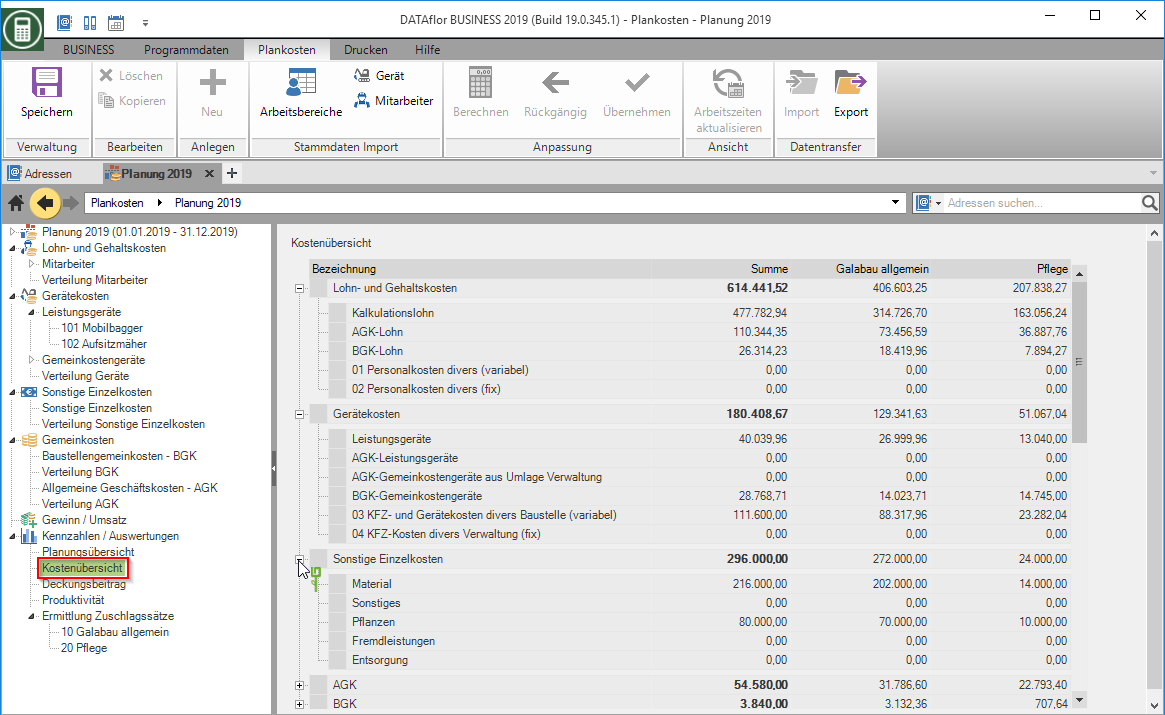
Select the entry in the directory tree Cost overview, the recorded costs of this planning are shown on the right side of the screen, summarized according to cost type groups.
contribution margin
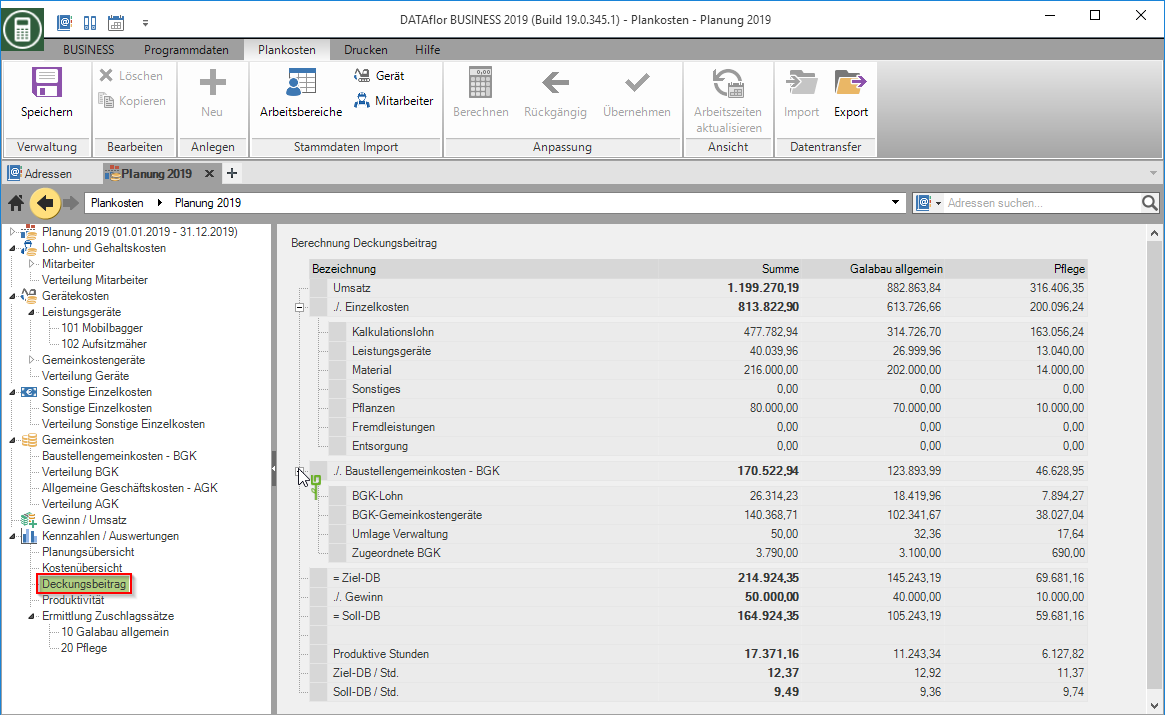
Select the entry in the directory tree contribution margin, the contribution margin calculations based on the planning for the entire company and the individual work areas are displayed on the right-hand side of the screen.
Productivity
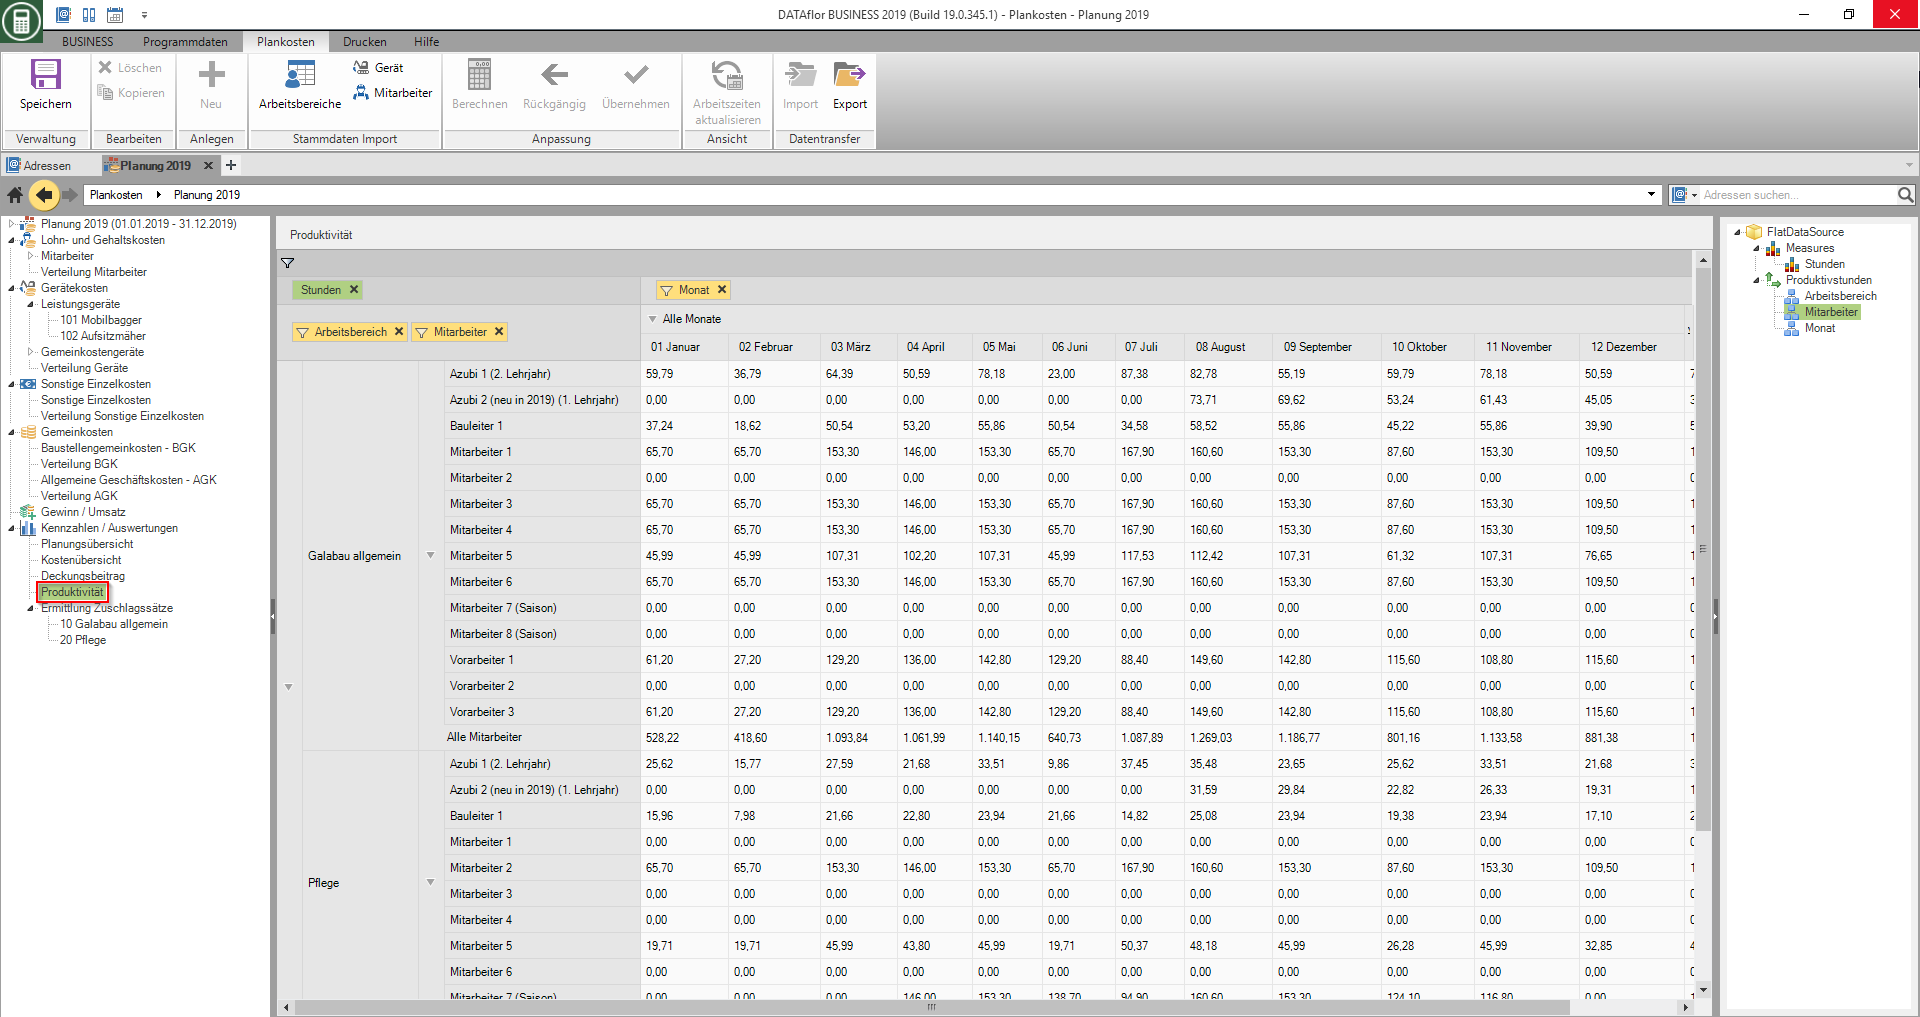
Select the entry in the directory tree Productivity, a pivot table is available on the right-hand side of the screen to display productivity. Set the pivot table, for example, to evaluate the distribution of productivity across the work areas, according to employees and months.
Determination of surcharge rates
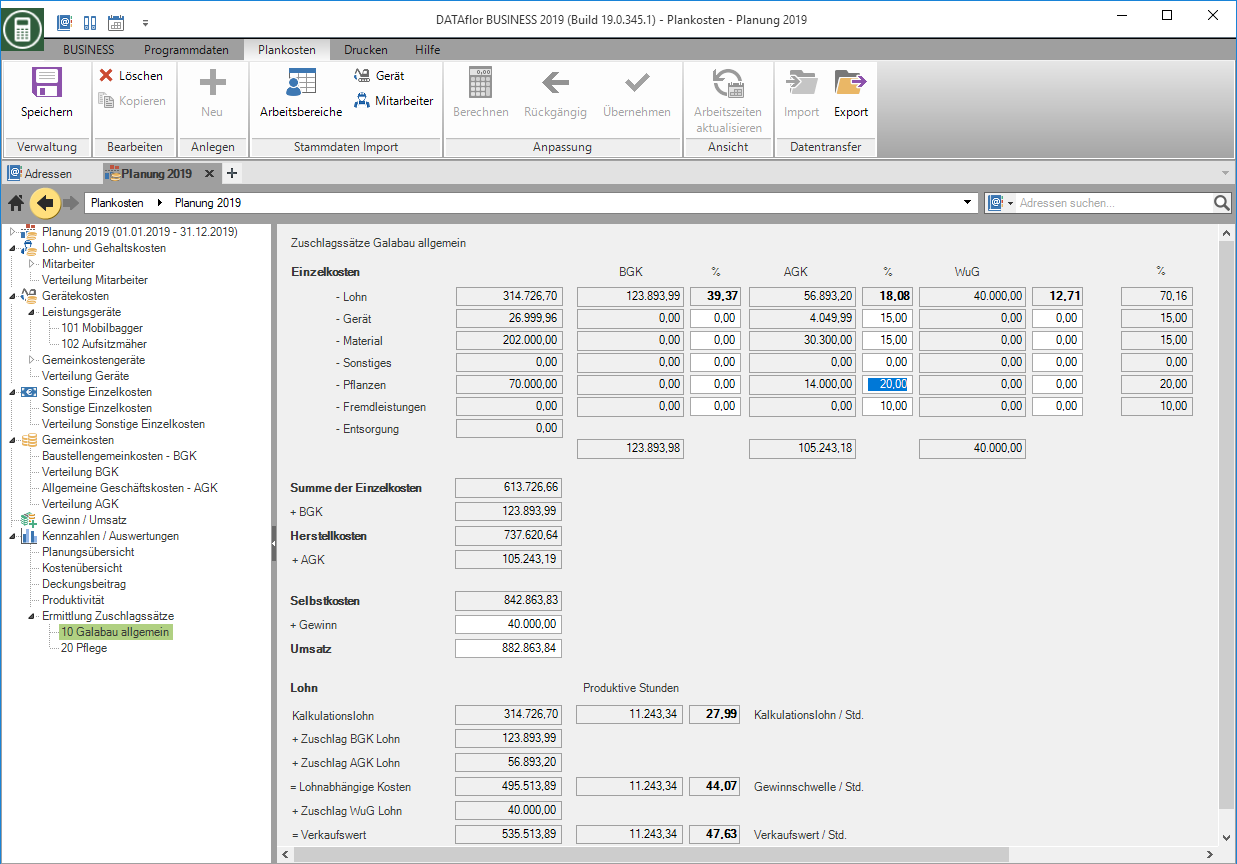
Open the folder in the directory tree Determination of surcharge rates and highlight a work area, the costs for determining the new surcharge rates are displayed on the right side of the screen.
- Enter the new surcharge rates for the direct costs separately according to BGK, AGK and profit.
- The remaining costs will be charged by the program based on the Direct wage costs determined automatically.
You can also use the Print overhead rates.

